Debugging with Serial Communications
Table of contents
It’s helpful to know what’s happening with your circuits when you’re building them for them first time and developing the interactivity.
We want to be able to ‘see’ what’s happening, the values our sensors might be giving and the way in which interactive decisions are playing out in real time.
If you have your Particle Core connected with the USB cord to your computer you can take advantage of serial communications to do this.
Serial Communication
This is a standard communication protocol for sending messages between computing devices and connected peripherals, for example mice or other USB devices. You can read more: https://learn.sparkfun.com/tutorials/serial-communication
Beginning Serial Communications
The primary use of Serial Comms is communicating with attached devices, but we can also use it to have your microcontroller send us messages about what it’s doing.
Adding messages to explain what is happening interactively with the microcontroller is a key part of programming - debugging or finding bugs or errors in our code. We use Serial communications to give us clues about what is happening and to help locate problem points in our program so we can correct it.
To use Serial communications for Debugging, you need only three commands:
Serial.begin( rate )
For all of these commands we’re using the Serial library, which is included by default. begin() lets us specific what rate the communication takes place at. Most always it 9600. begin() is normally included in the program’s setup() too. See https://docs.particle.io/reference/firmware/photon/#begin-
Serial.print( var )
This let’s us spit out a bit of information. This could be a piece of text, a number or a single character. It’s really useful for sending out some data a piece at a time.
Serial.println( text )
This let’s us spit out a piece of information, and adds a new line (or a return) so that the next piece of information appears starting at the beginning of the next line.
An example
// Create a variable
// To store an integer
int count = 0;

void setup()                    // run once, when the sketch starts
{
  Serial.begin( 9600 );         // Setups Serial Communications
}

void loop()                     // run over and over again
{
  Serial.print( "Looped " );    // Output a String
  Serial.print( count );        // Output the number of loops
  Serial.println( " times" );   // Output the end of line
  count++;                      // Increment the value
  delay(1000);                  // waits for a second
}

// This will print out
// Looped 0 times
// Looped 1 times
// Looped 2 times
// … and so on
Seeing Serial Information
Luckily, the Particle Dev has a built in way to see Serial communications, called the Serial Monitor.
In order to see output from a Microcontroller’s serial comms.
-
Connect your Partice device to your computer’s USB drive
-
Upload your Sketch to the core.
-
Wait until your core has flashed.
-
Use the CLI to view serial communications by typing
particle serial monitor -
You should now see something like this
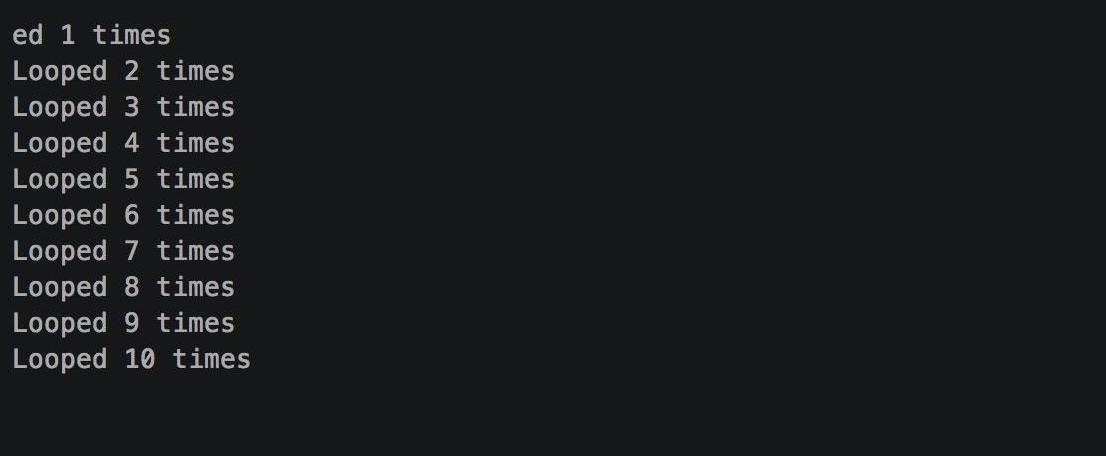
Changed your program?
Note: If you change the program and upload it again, you will need to reconnect each time and repeat steps 4 and 5
Hints
When debugging think of how you can have the microcontroller tell you the story of what’s happening. For example:
Add a Serial.print() or Serial.println() statement inside your if statements to see which branch has been reached
Find out what values your sensors are giving back by displaying their readings
Show what methods and functions are being called (including event handlers for Particle.subscribe) by including a Particle.println("e;Reached myMethodName"e;) inside the function